Create a custom dashboard in vROPs
Creating a dashboard in vRealize Operation Manager has been made significantly easier over the years. Here we will create a simply dashboard that let you choose a cluster and pull up some basic information about it.
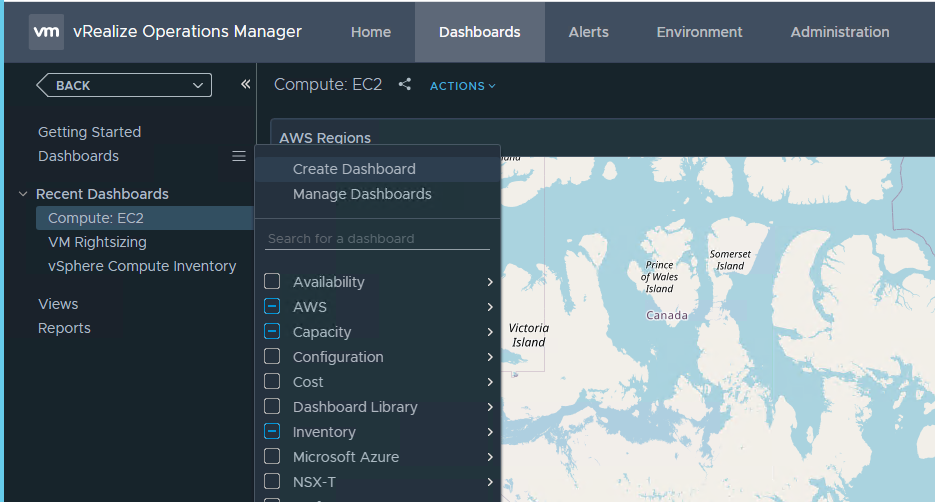
- Go to Dashboards and select Create Dashboard
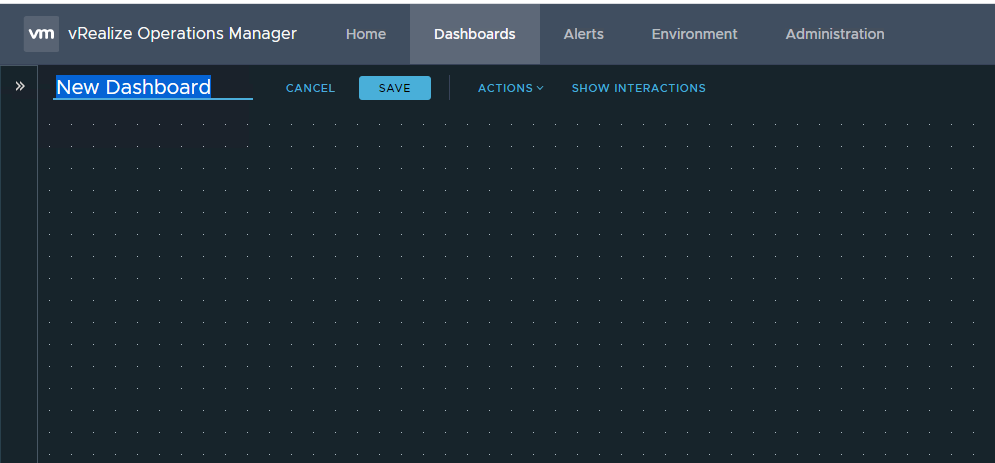
- Enter a name for your new dashboard
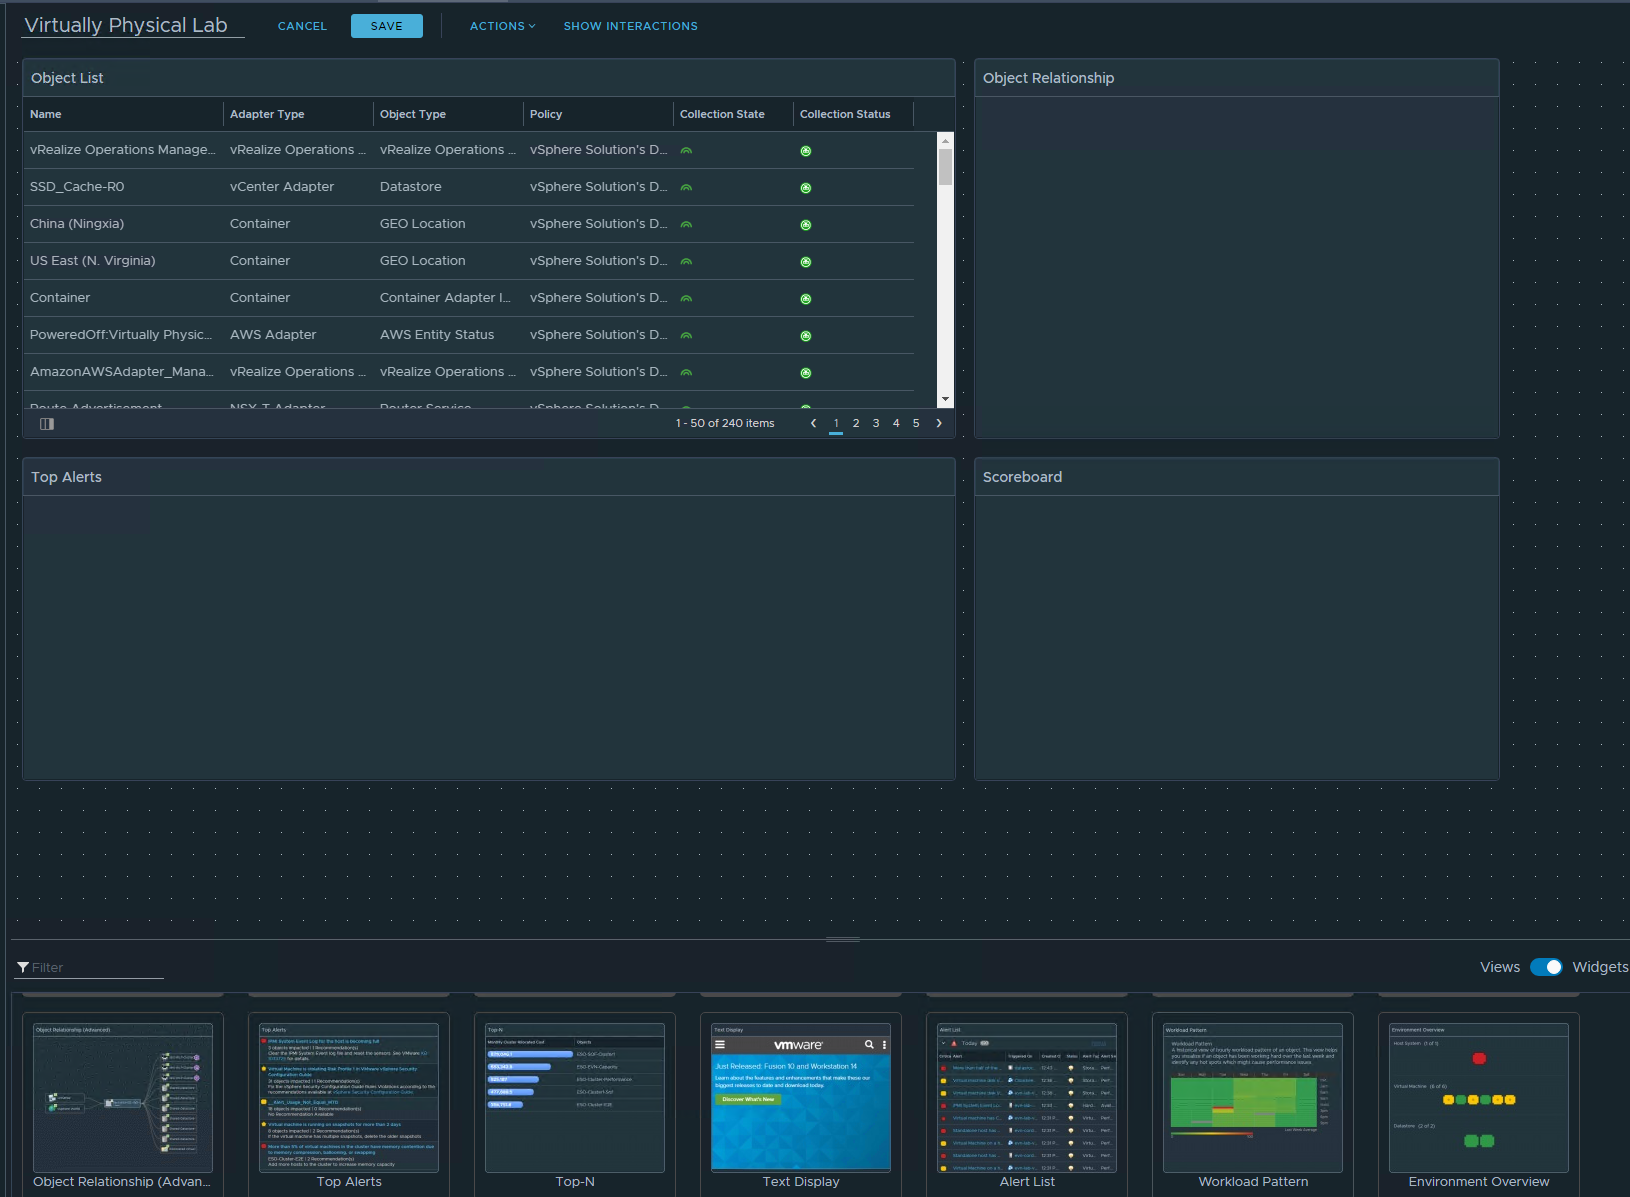
- Using the toggle switch at the bottom to move between Views and Widgets, youre going to drag at drop what you need into the dashboard. From there you can resize them to meet your requirements.
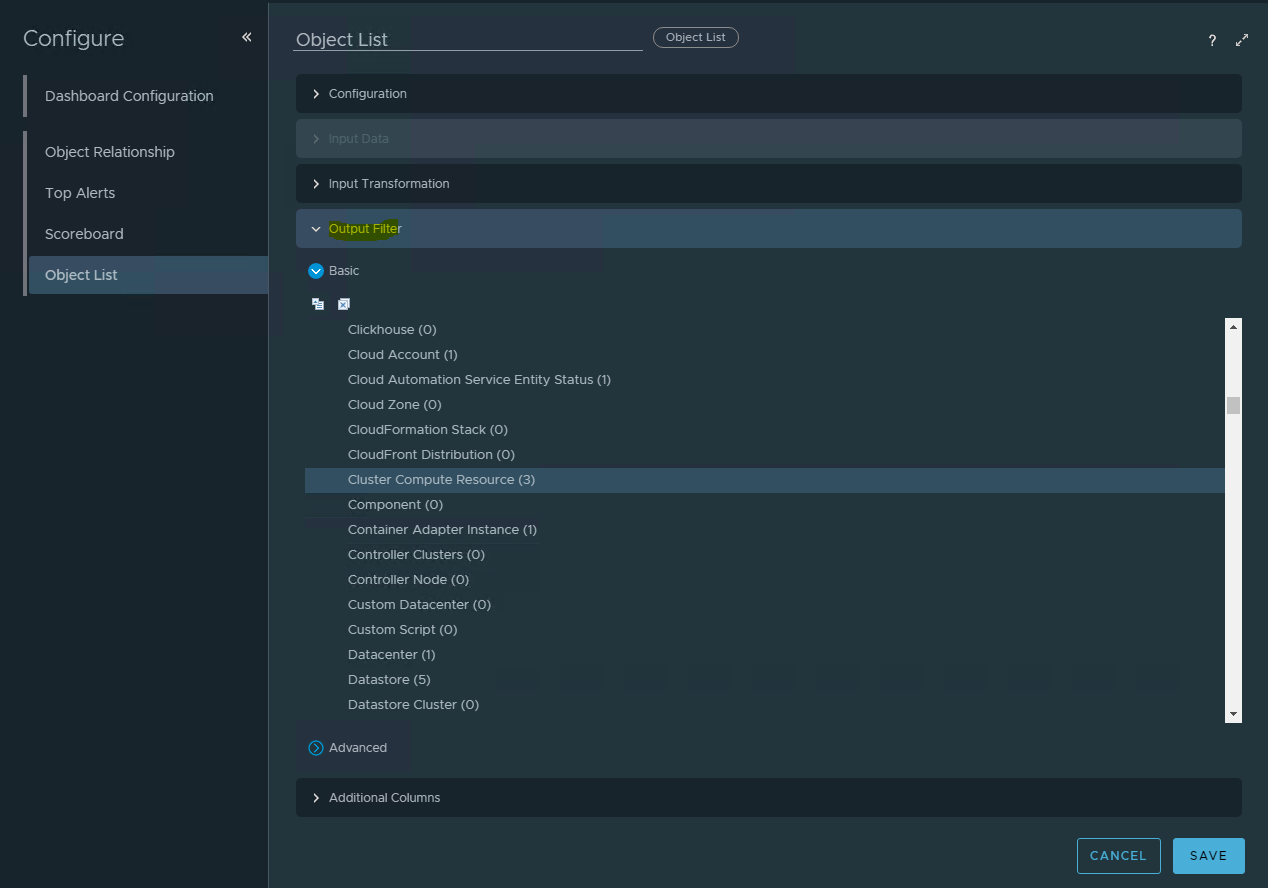
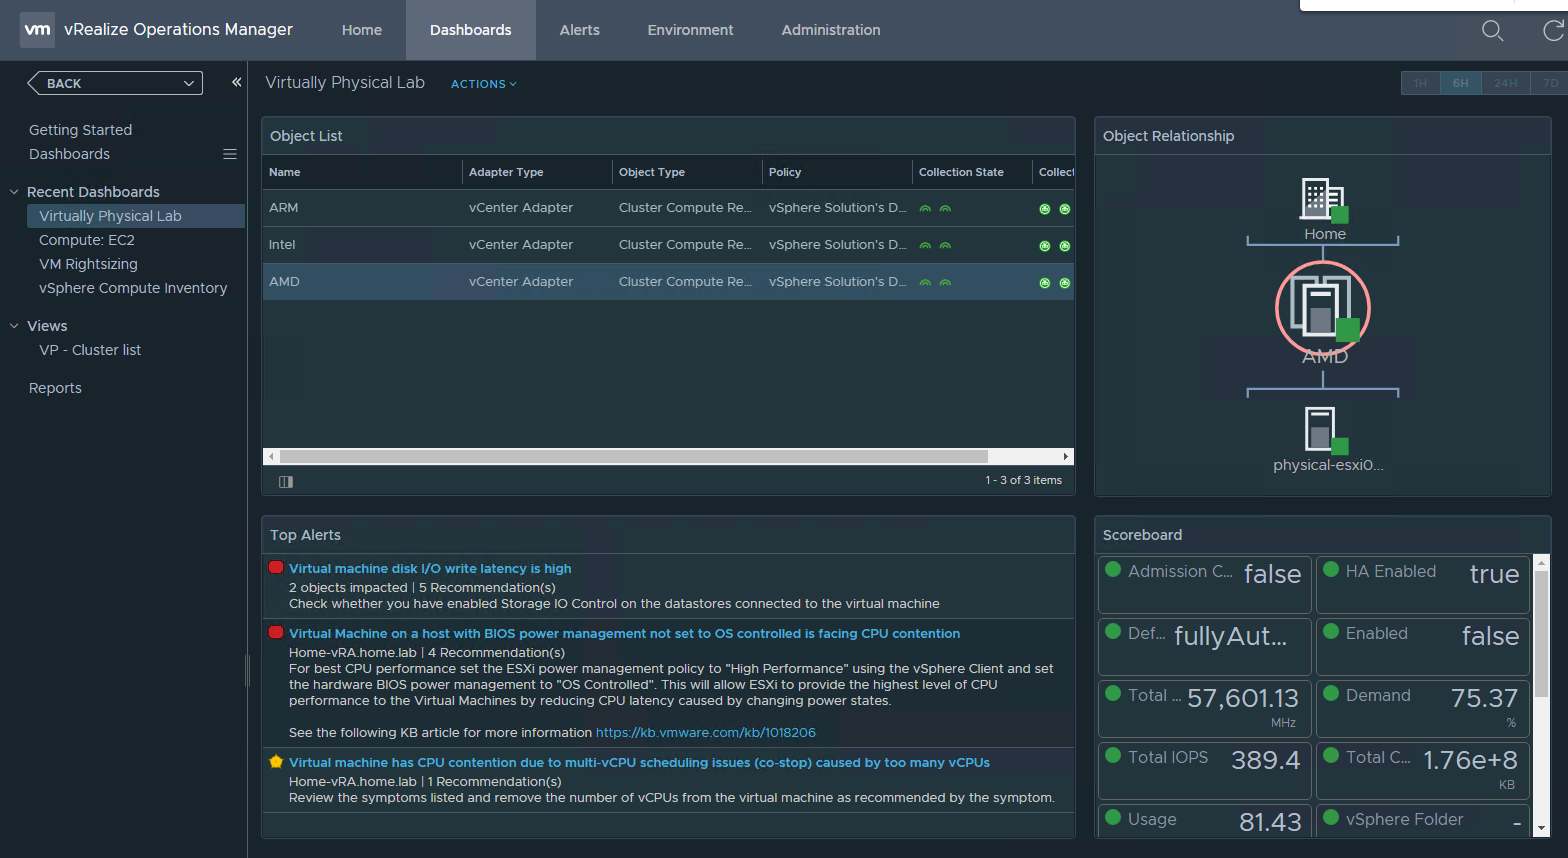
- By default, Object List will display all objects that vROPs is aware of, obviously this isnt ideal as there could be many thousands of objects. To limit this to what we want to see, were going to edit the widget, select Output Filter and then select Cluster Compute Resource so that only the clusters will be listed
- No we need to link the widgets so that once we select a cluster, it will customise the data in your other widgets to be specific to what you have chosen. This is just a case of dragging and dropping
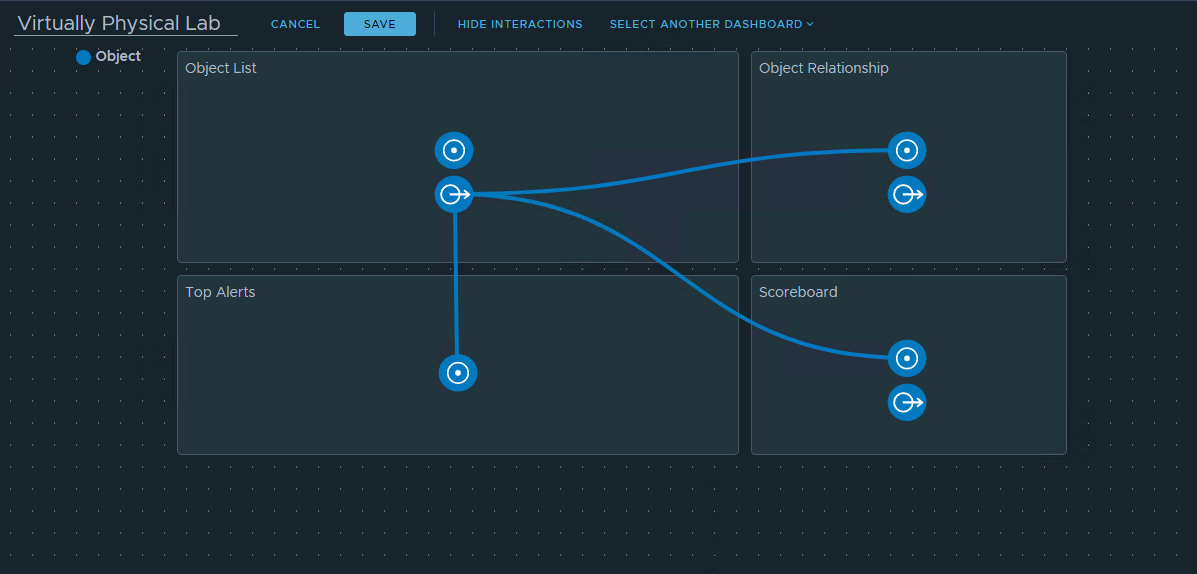
- Finally, click save and test out your dashboard.
![]()