Create a vRLI Custom Dashboard
Now that you have vRealize Log Insight ingesting all those logs, your next stop is going to be making sense of all that data in a way thats meaningful to you or your service owners. Luckily its very straight forward to create custom dashboards.
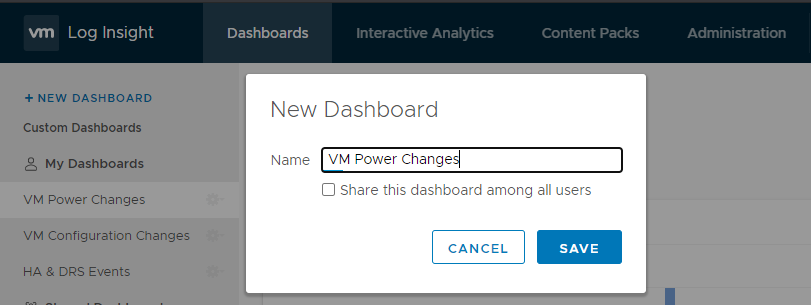
- Create a dashboard, remember to click share if you want other users to be able to view it
- Now you need to define the information you need to display, in this example we’re going to create a dashboard that shows you VM power changes on the cluster called AMD. Go to Interactive Analytics and start to define the settings you want, for a Powered Off view were going to use the following:
Unique count of vmw_esxi_vm_name
over time grouped by vmw_esxi_vm_name
Search: poweredoff
Filter: vmw_cluster Contains amd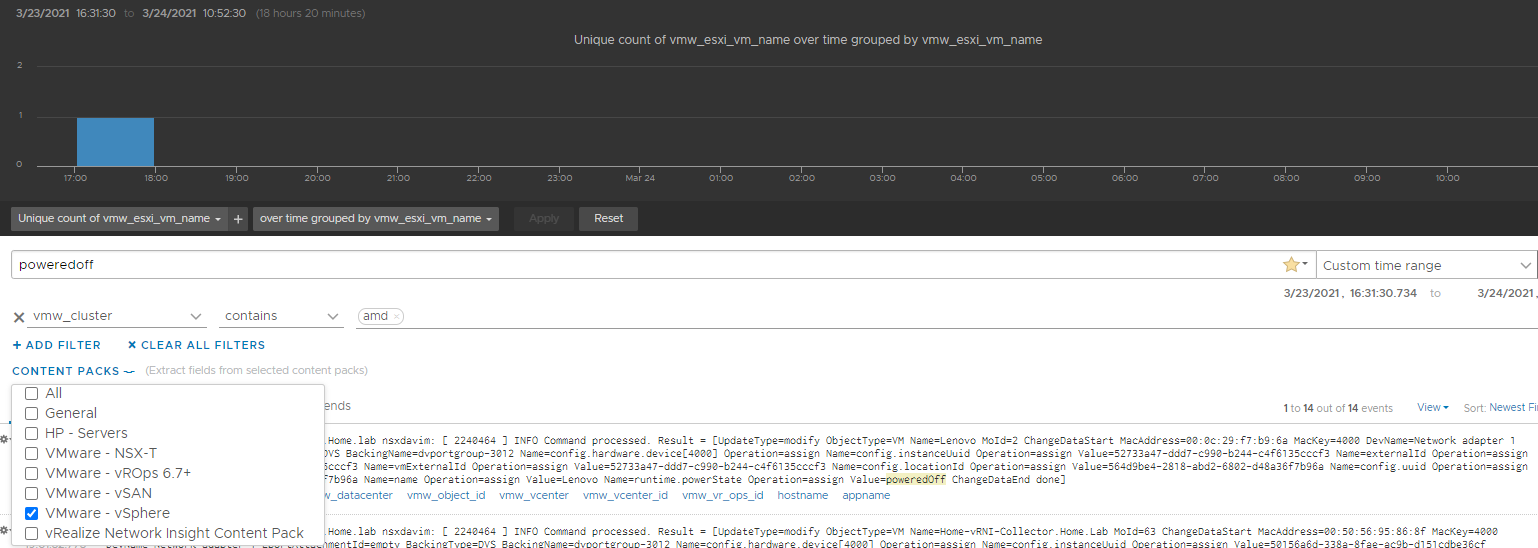
- Add your filter to your previously created dashboard

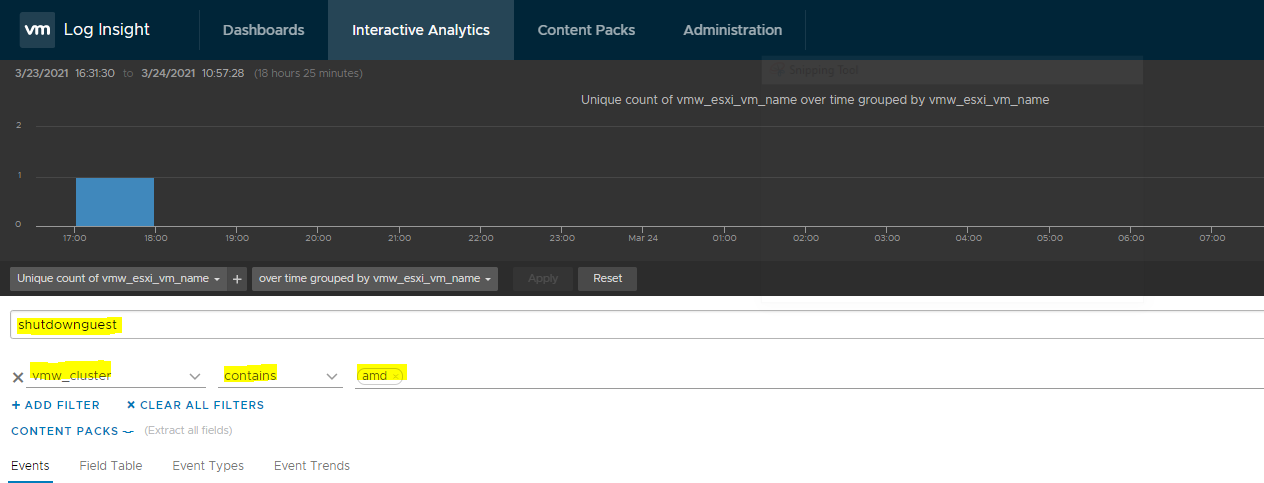
- Repeat for additional views
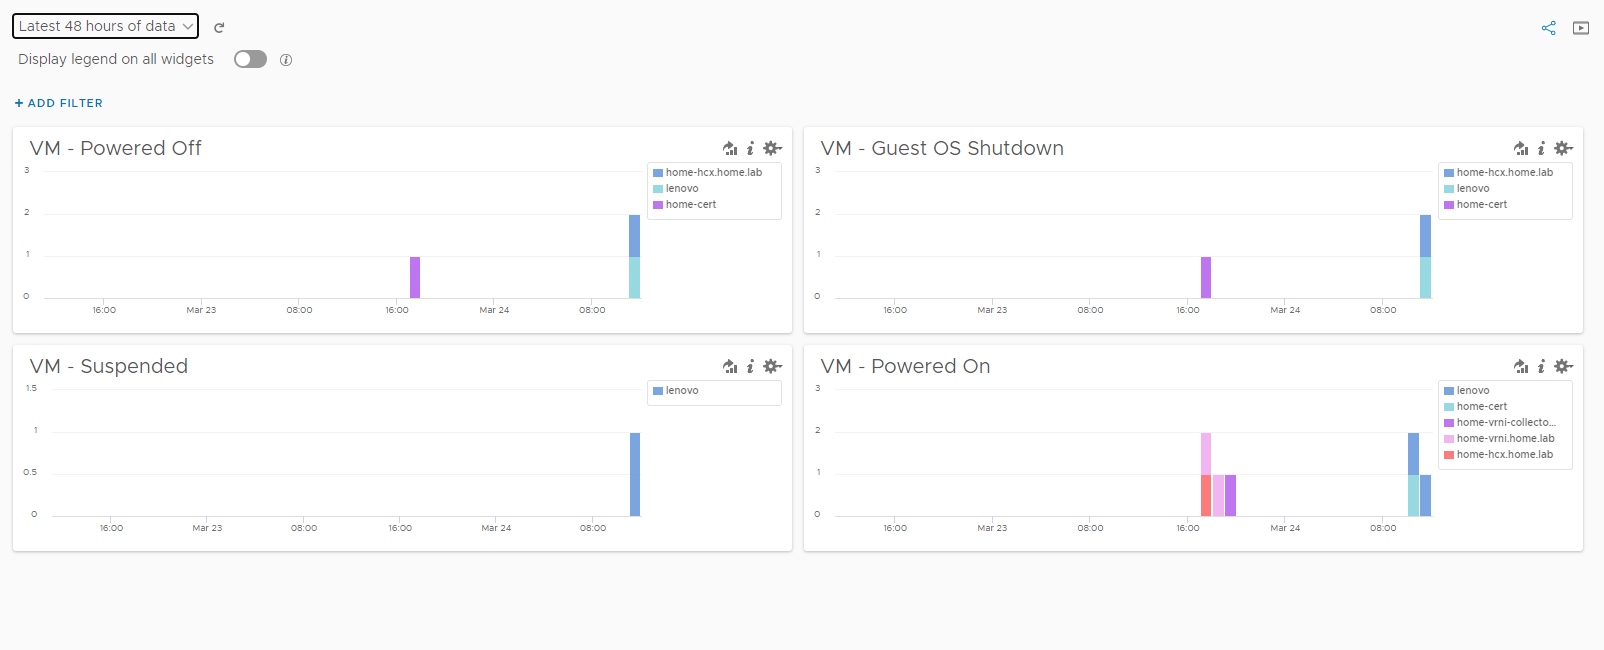
- Repeat until your dashboard is complete

Its likely some of your views are going to be very similar in nature, if you wish to reuse one simply find it on your dashboard -> Click Options and select Edit in interactive Analytics , once you’re done save it to the dashboard under a different name 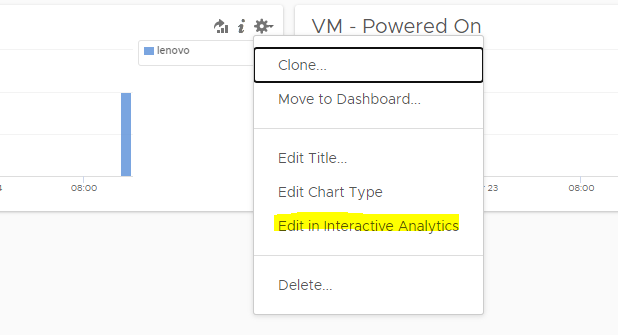
![]()